Welcome to ...

The MultiWavelength Sky
Web Page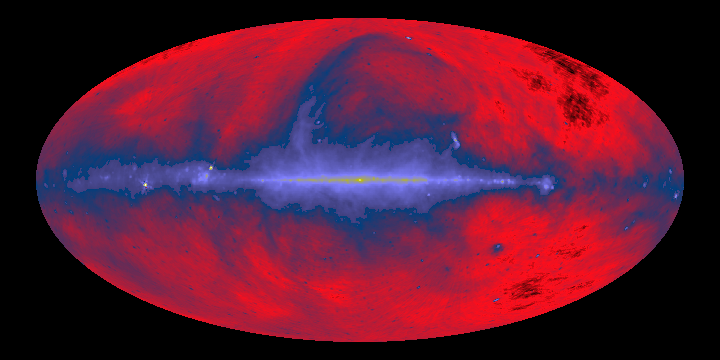
Credit: Max Planck Institute for Radio Astronomy, generated by Glyn Haslam
Comment: This survey is a mosaic of data taken at Jodrell Bank, Effelsberg and Parkes telescopes. The data was distributed in the "NRAO Images from the Radio Sky" CD ROM. This image was generated by SkyView.
Energy= 1.69x10^-6 eV Frequency= 408x10^6 Hz (408MHz) Wavelength= 73.5 cm
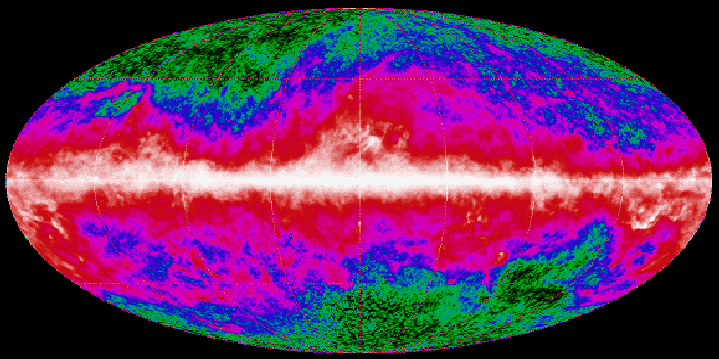
Credit: NASA Goddard Space Flight Center,
Cosmic Background Explorer (COBE) Project
Comment: This image was created using data from the
COBE Diffuse Infrared Background Experiment (DIRBE) and represents
the annual average map at 240 microns.
Energy= 5.18x10^-3 eV
Frequency= 1.25x10^12 Hz
Wavelength= 2.40x10^-2 cm (240 microns)
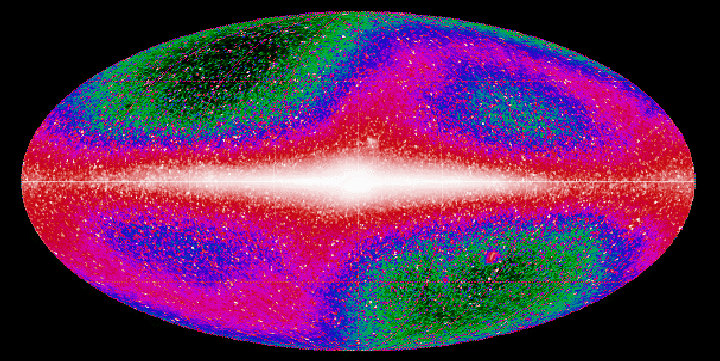
Credit: NASA Goddard Space Flight Center,
Cosmic Background Explorer (COBE) Project
Comment: This image was created using data from the
COBE Diffuse Infrared Background Experiment (DIRBE) and represents
the annual average map at 3.5 microns.
Energy= 0.36 eV
Frequency= 8.6x10^13 Hz
Wavelength= 3.5x10^-4 cm(3.5 microns)
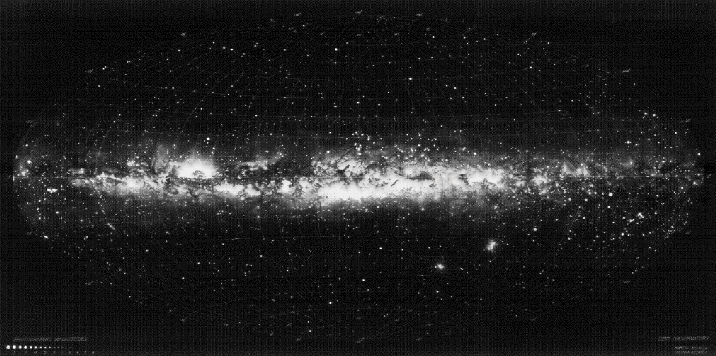
Credit: Lund Observatory
Comment: This all-sky panoramic image was created under the
direction of Knut Lundmark at Lund Observatory in the 1940s.
Energy= 2.5 eV
Frequency= 6.0x10^14 Hz
Wavelength= 5.0x10^-5 cm(5000 Angstroms)
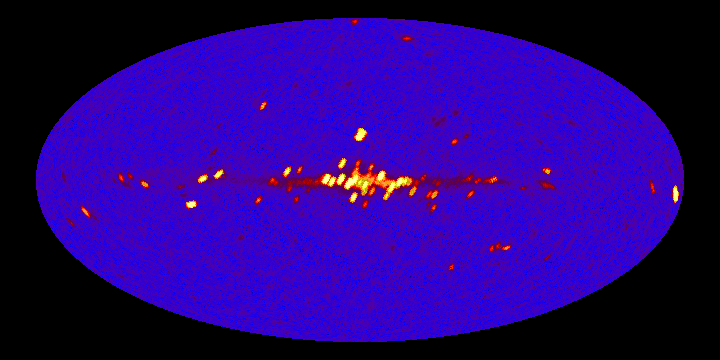
Credit: NASA Goddard Space Flight Center, original map
generated by Keith Jahoda.
Comment:This all-sky map was made from
roughly six months of scanning data from the A2 instrument on board
the HEAO-1 satellite. This image was generated by SkyView.
Energy= 2keV - 10keV
Frequency= 5x10^17 Hz - 2.5x10^18 Hz
Wavelength= 6.2x10^-8 cm - 1.2x10^-8 cm (6.2 - 1.2 angstroms)
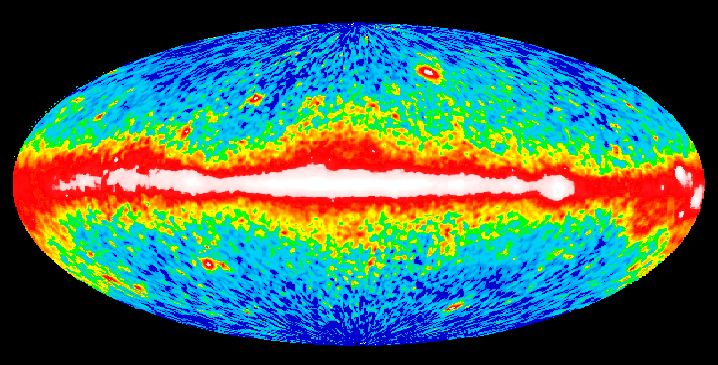
Credit: NASA Goddard Space Flight Center,
Compton Gamma-Ray Observatory (CGRO)
Comment: This map was generated by the EGRET (Energetic Gamma-Ray
Experiment Telescope) team at Goddard using EGRET data from the
first year of CGRO operations (beginning April 1991). It represents the
first all-sky survey at energies above 100keV.
Energy= > 100MeV
Frequency= > 2.5x10^22 Hz
Wavelength= < 1.2 x 10^-12 cm ( < 0.00012 angstroms )