Astronomy Picture of the Day
Discover the cosmos! Each day a different image or photograph of our fascinating universe is featured, along with a brief explanation written by a professional astronomer.
2014 March 18
Discover the cosmos! Each day a different image or photograph of our fascinating universe is featured, along with a brief explanation written by a professional astronomer.
2014 March 18
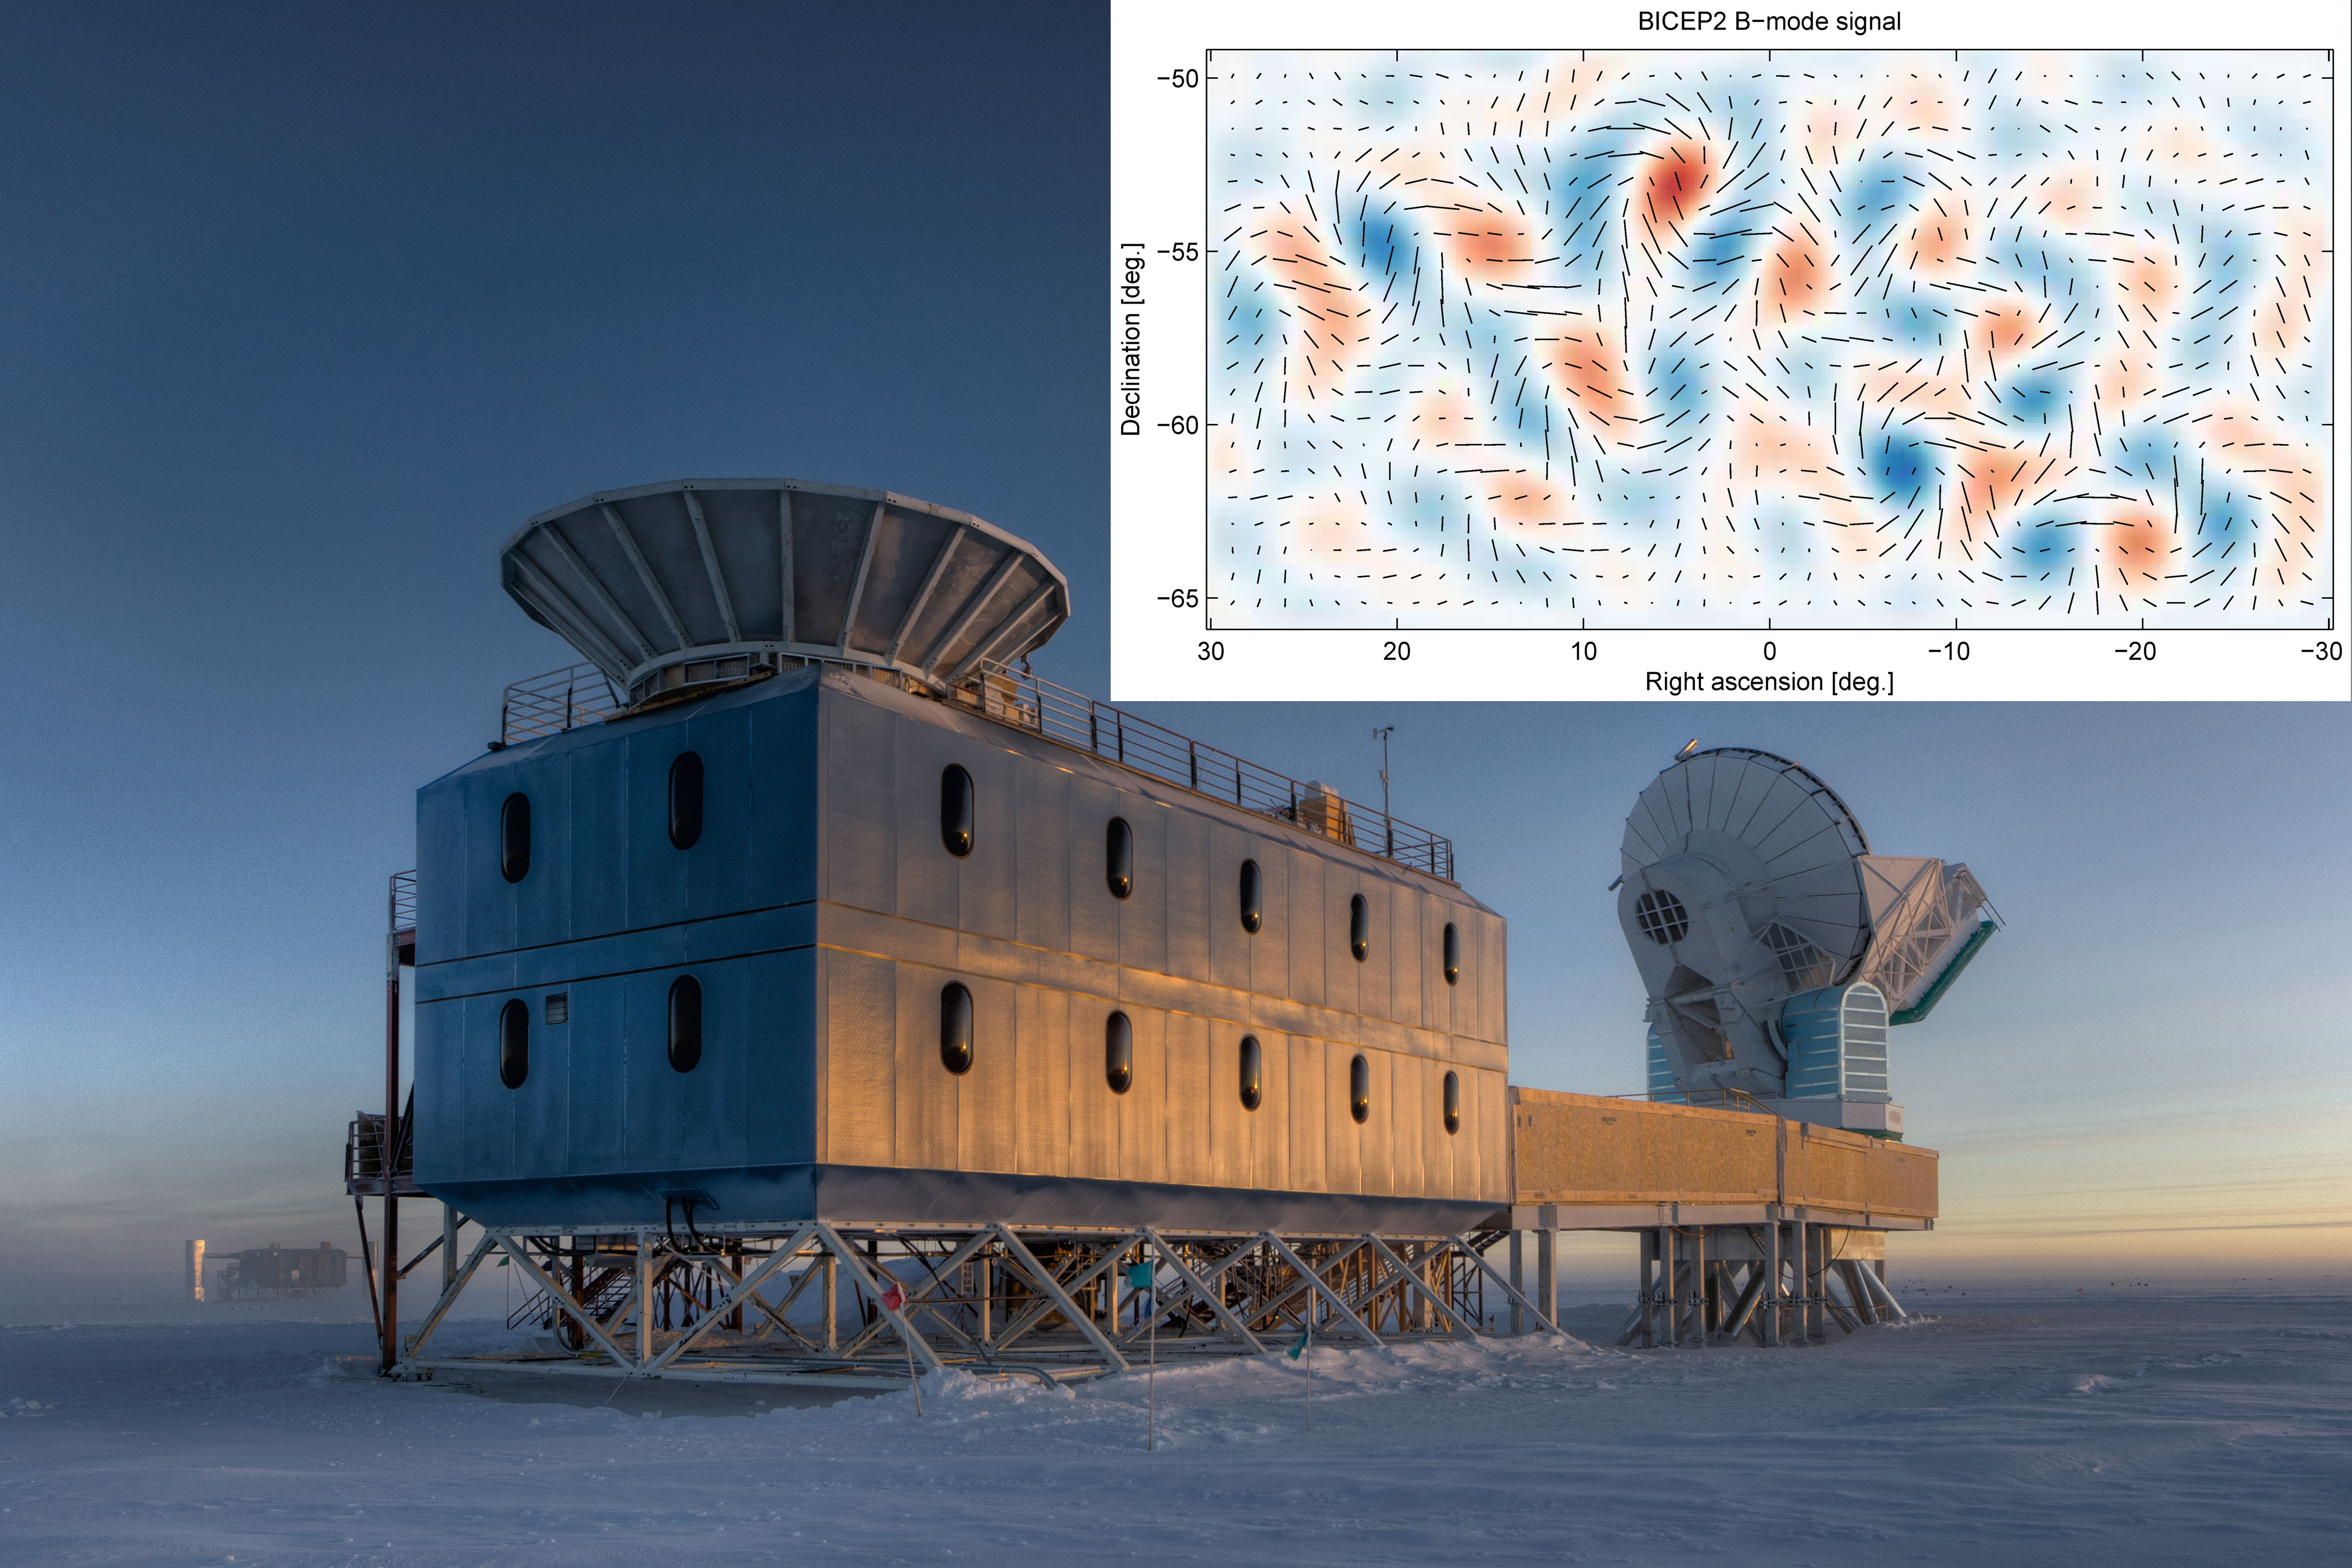
Explanation: Did the universe undergo an early epoch of extremely rapid expansion? Such an inflationary epoch has been postulated to explain several puzzling cosmic attributes such as why our universe looks similar in opposite directions. Yesterday, results were released showing an expected signal of unexpected strength, bolstering a prediction of inflation that specific patterns of polarization should exist in cosmic microwave background radiation -- light emitted 13.8 billion years ago as the universe first became transparent. Called B-mode polarizations, these early swirling patterns can be directly attributed to squeeze and stretch effects that gravitational radiation has on photon-emitting electrons. The surprising results were discovered in data from the Background Imaging of Cosmic Extragalactic Polarization 2 (BICEP2) microwave observatory near the South Pole. BICEP2 is the building-mounted dish pictured above on the left. Note how the black polarization vectors appear to swirl around the colored temperature peaks on the inset microwave sky map. Although statistically compelling, the conclusions will likely remain controversial while confirmation attempts are made with independent observations.
Authors & editors:
Robert Nemiroff
(MTU) &
Jerry Bonnell (UMCP)
NASA Official: Phillip Newman
Specific rights apply.
NASA Web
Privacy Policy and Important Notices
A service of:
ASD at
NASA /
GSFC
& Michigan Tech. U.